APPLICATIONS
Attempts to improve the sensitivity of the instruments and their sensitivity to unexpected phenomena have produced some useful applications.
The electrodynamic pluviometer
The sensitivity of CIEN station electrodes to rainfall was converted in a project with the aim of
building a new type of rain gauge. The project was financed by the Umbria Region and developed
at the "Andrea Bina" observatory in Perugia, from 2013 to 2015. The Bina Observatory is today
dedicated to the seismic monitoring of the Perugia territory, but in the past, it was devoted to
meteorological research with the invention of the first rain rate meter by Father Benedetto Castelli
and Galileo Galilei in 1639, and the Paoloni's anemometer in 1930. In July 2016 a patent was filed
for the new instrument measuring the rain rate, with a temporal scale up to seconds and a
completely solid-state device. The environment today is even more susceptible to landslides and
floods, therein constituting a danger to the safety of persons. In fact, storms can produce unexpected
and localized heavy concentrations of rainfall. A network of low-cost instruments able to measure
rapid heavy rainfall over large areas would allow us to assess dangerous events. Radars can only
partially satisfy the necessity of extended monitoring, as they are highly inaccurate at measuring the
amount of rainfall on irregular surfaces. Moreover, radars, which are known to be associated with
health risks, must satisfy numerous restrictions when placed near populated areas. Radars are
costly to maintain and have a significant environmental impact. This rain gauge is small in dimensions.
It can be easily fastened to a common sill and connected to a PC by a USB or used with a wireless
solution. The invention is made up of two discs of different diameters joined by a rod of about 10 cm.
The flat circular disk of a few square centimeters which constitutes the sensor is placed at the top
with its axis parallel to the vertical axis (see the picture on the right). The disk having a larger
diameter acts as the anchoring base and contains the electronics of the device. This disc is
characterized by holes at more points so as to be able to fasten it to various solutions. Patent No. 102016000077834 was approved in January 2019. The instrument capacity was investigated during some rainfall events (see Fidani and Siciliani, 2025).
Forecasting strong earthquakes
The statistical correlation calculated over more than 16 years of data collecting the time difference between strong earthquake occurrence and electron burst detection, which was demonstrated to exist with particle loss anticipating seismic activity of about 2 - 3 hours, opens a question: could it be used for future strong earthquake forecasting?
Taking into account that a physical model is essential for proving that a statistical correlation corresponds to a phenomenological link, the response is affirmative. It can be realized by calculating the probability of an earthquake event throughout the relationship between the covariance and cross-correlation (corr). This method is completely general and applicable to every couple of correlated events, even if they are unitary events. The cross-correlation is
where cov is the covariance, and where P(EQ) and P(EB) are the independent probabilities of earthquake (EQ) and electron burst (EB) occurrence, respectively. The conditional probability
This means that, if a correlation exists between EQs and EBs, and the time difference is chosen to be that of correlations between EQ and EB events, the probability of a strong EQ is increased by a term proportional to the correlation. The number of false alarms can be estimated in a programmed experiment (see Fidani, 2018).
The performance of a specific method is carried out through the statistical parameters that can be evaluated in this example, such as the success rate P(EQ|EB), the false alarm rate 1 – P(EQ|EB), the alarming rate P(EB) + corr(EQ,EB)√[1 – P(EQ)]P(EB)[1 – P(EB)]/P(EQ), the failure rate 1 – P(EB) – corr(EQ,EB)√[1 – P(EQ)]P(EB)[1 – P(EB)]/P(EQ), and the probability gain (see Fidani, 2021)
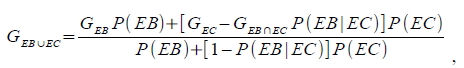
If two dependent precursors, EB and EC, that generate alarms in the same space-time volume are considered, which means, for example, electron bursts EB and magnetic pulses EC, where electron bursts can be physically induced due to magnetic pulses (see Fidani, 2021), the conditional probability on EQ can be calculated by probability gains GEB and GEC due to electron bursts and magnetic pulses, respectively. Given the observations of an event in the set of both precursors EB and EC, the combined probability gain can be expressed as
which is useful, as the observation of ECs on the Earth's surface can occur when a NOAA satellite is not in a suitable position to reveal the possibly induced EBs. Moreover, magnetic detectors cannot be installed at some positions offshore or are not able to detect ECs where there are EQs. In other words, EBs and ECs can compensate for the gaps between each other in a forecasting experiment where the space-time volume is very large.
Time-delayed mutual information and transfer entropy have also been calculated analytically for binary events, which are useful for the non-linear complex dynamical system such as the lithosphere-ionosphere system. The time-delayed mutual information can be expressed using G as
I(EQ;EB) = − G P(EQ)P(EB) log {[1/ G − P(EQ)][1 − G P(EB)]} − log {[1 − P(EQ)][1 − P(EB)]} +
+ P(EQ) log {[1 − P(EQ)][1 − G P(EB)]} + P(EB) log {[1 − P(EB)][1 − G P(EQ)]} +
+ {1 − P(EB) − P(EQ)[1 − G P(EB)]} log {1 − P(EB) − P(EQ)[1 − G P(EB)]},
Instead, transfer entropy can be calculated, including correlations between consecutive earthquake events and between consecutive earthquakes and electron bursts. The expression can be found in Fidani, 2022.
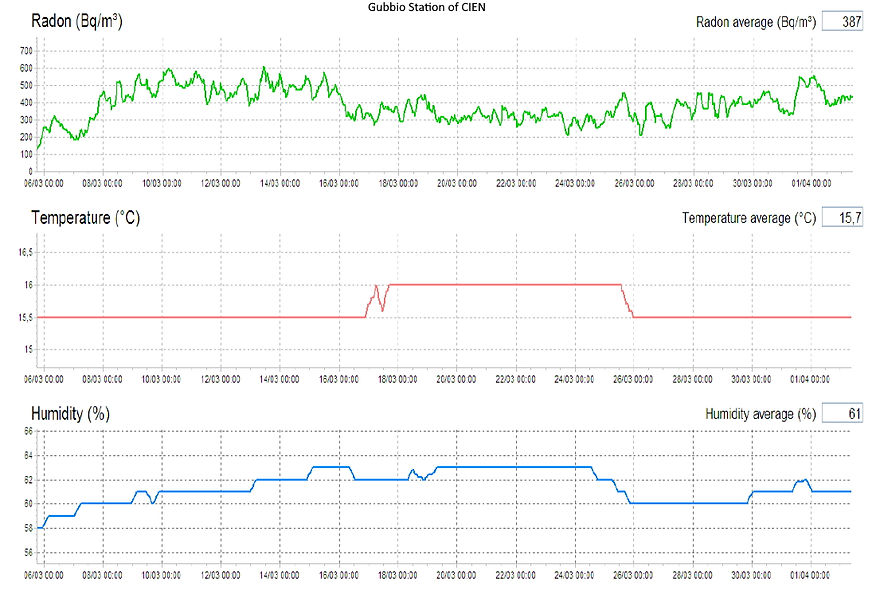
Radon safety
Radon is present everywhere on the Earth's surface and comes mainly from granite and volcanic basements as well as certain building materials. Radon can accumulate in confined spaces, especially in homes and underground places like cellars, and can pose a risk to health. The ALGADE detector installed at Gubbio Station to monitor radon emission during seismic activity is able to keep the gas level under control in a cellar that is always closed (see Alberi et al., 2019).
VLF transmitters monitoring
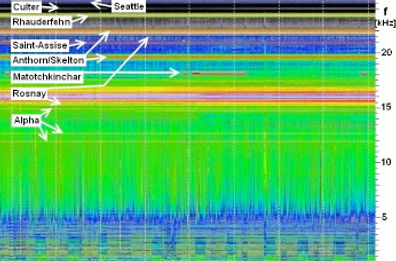
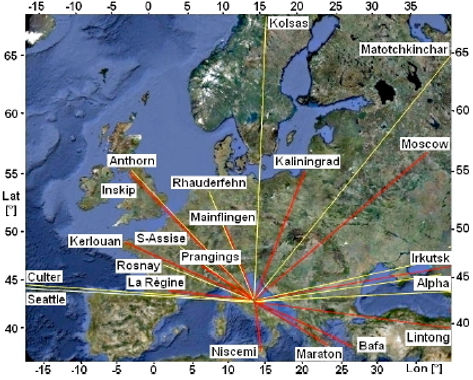
The power spectrum of the VLF and LF band recorded at the Chieti Station is
on the right. Carrier waves of transmitters are indicated by white arrows and
the power spectrum intensity scale is shown on the bottom of the pictures.
The set of monitored sub-ionospheric channels, VLF in yellow and LF in red,
from the Chieti Station with the transmitter's position depicted on a Google
Map. Several sub-ionospheric signals from different VLF and/or
transmitters overlap along the same channels, which is an important feature
of a reliable system that is able to verify a single channel perturbation from at
least two signals. Additionally, different CIEN stations are able to recognize
overlapping in the same direction of different transmitters, which allow to
check their correct operation (from Fidani, 2011).
Mu-metal magnetometers
To improve the magnetometer's sensitivity a new kind of technological
solution was developed to build the induction sensor. A coil core in
Mu-metal was used, which allow the instrument to record Schumann
Resonances. Principally developed for both ELF and ULF bands, it is
therefore, able to reach the pT/Sqrt (Hz) threshold in recording
geomagnetic variations. A magnetic spectrogram recorded by the new
instrument installed at the Fermo Station is on the right, where dotted
vertical white lines indicate the time interval of five minutes. Here, an
hour and a half of the recorded spectrum includes the first three
Schumann Resonances along with five pulselike perturbations
between 4 and 5 Hz. This device is electrically shielded and not very
sensitive to meteorological activity while results being very sensitive
to ground vibrations. Despite signal equalization, the cutoff frequency
of the sound card suppresses frequencies below 1 Hz, whereas the
device filters cut frequencies higher than 50 Hz.